
- June 3, 2026
Palm Coast residents are pleased with the city’s natural environment, recreational opportunities and walking paths, but less happy about its economic development, according to information from the city’s annual National Citizen Survey.
The survey was sent out to about 1,200 Palm Coast homes last year and allows city officials to compare Palm Coast to a benchmark of 500 communities across the country.
Of the 1,200 surveys, 379 were returned, Palm Coast Senior Environmental Planner Denise Bevan said at a city council workshop Tuesday morning.
“You can see that we are making a difference, and our citizens are reflecting that in this survey,” Bevan said, pointing to the rise in the percentage of citizens satisfied with city walking paths, which has grown from 53% in 2009 to 78% in 2013. The 2013 percentage is above the national benchmark.
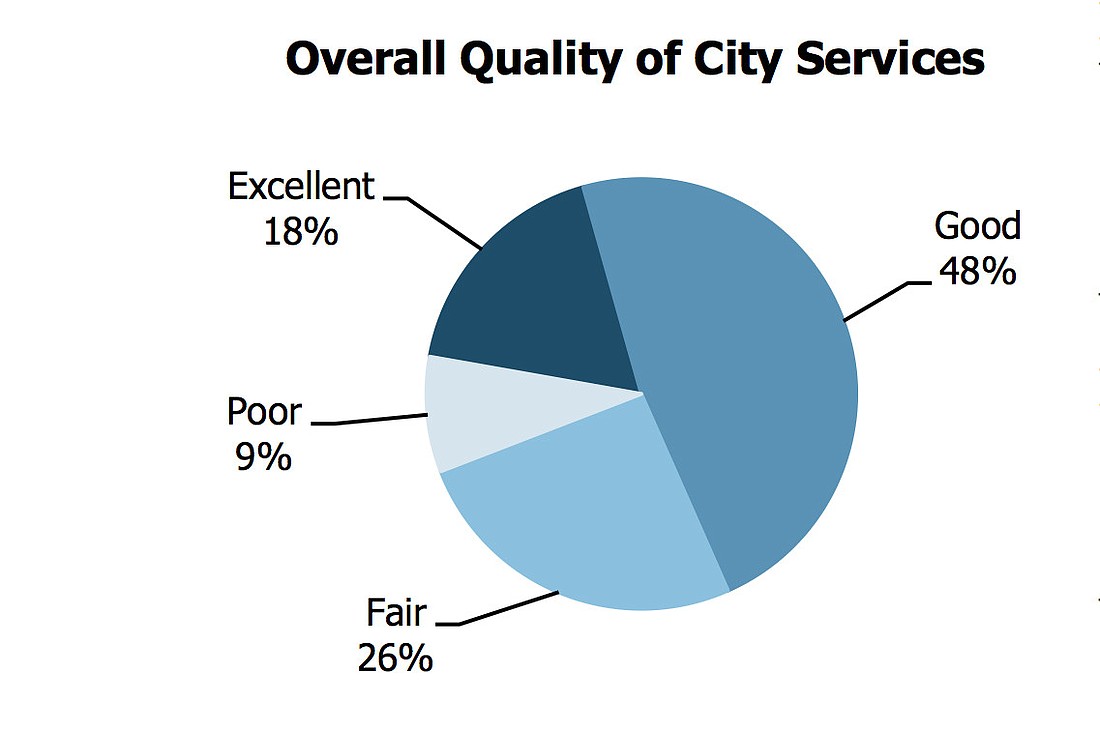
A total of 74% of residents surveyed rated the city’s overall quality of life as “good” or “excellent,” a percentage in line with national benchmarks.
Features of Palm Coast that rated higher than the national benchmark were:
Paths and walking trails (87%)
Cleanliness (85%)
Affordable quality housing (64%)
Child care/preschool (63%)
Street repair (64%)
Sidewalk maintenance (70%)
Features of Palm Coast that received ratings lower than the national benchmark were:
New development in Palm Coast (42%)
Overall economic health (36%)
Vibrant downtown/commercial area (32%)
Employment opportunities (13%)
Place to work (18%)
Education and enrichment opportunities (58%)
Street lighting (41%)
Traffic signal timing (39%)
Drinking water (56%)
Storm drainage (43%)
Economic development (34%)
Special events (58%)
Questions that asked residents to rate their own participation yielded only one in which Palm Coast had a rating higher than the national benchmark: emergency preparedness. A total of 54% of survey respondents said they had stocked supplies for an emergency.
A number of other citizen participation measures rated below national benchmarks, including the percentage of residents who replied “yes,” “more than once a month,” or “always /sometimes” in response to questions on whether they:
Used public transportation instead of driving (4%)
Carpooled instead of driving alone (30%)
Walked or biked instead of driving (42%)
Did NOT observe a code violation (31%)
Work in Palm Coast (33%)
Have done a favor for a neighbor (82%)
The city’s annual report detailed how the city attempted to address six goal areas in 2012-2013, including expanding of services and infrastructure, maintaining a strong economy, leveraging “financial strengths while ensuring the city remains committed to fiscal responsibility,” blending residential and commercial properties with Palm Coast’s “city of parks and trails” image, enhancing citizen quality of life and creating a comprehensive plan to improve city employees’ skills and performance.
The full annual progress report is available online HERE.
To view Palm Coast’s 2013 National Citizen Survey, CLICK HERE.
BOX: Palm Coast resident satisfaction, 2009-2013
The following statistics from Palm Coast's National Citizen Survey were highlighted in the city's 2013 Annual Progress Report:
Residents rating emergency preparedness as “excellent” or “good”:
2009: 71%
2010: 73%
2011: 69%
2012: 73%
2013: 68%
Residents rating paths and walking trails “excellent” or “good”:
2009: 53%
2010: 61%
2011: 70%
2012: 73%
2013: 78%
Residents rating storm drainage as “excellent” or “good”:
2009: 49%
2010: 43%
2011: 57%
2012: 63%
2013: 43%
Residents rating economic development as “excellent” or “good”:
2009: 33%
2010: 34%
2011: 31%
2012: 30%
2013: 34%
Residents rating value of services for taxes paid as “excellent or “good”:
2009: 56%
2010: 53%
2011: 54%
2012: 50%
2013: 54%
Residents rating overall natural environment as “excellent or “good”:
2009: 69%
2010: 80%
2011: 82%
2012: 81%
2013: 87%
Residents rating recreational opportunities as “excellent or “good”:
2009: 51%
2010: 53%
2011: 52%
2012: 58%
2013: 69%


